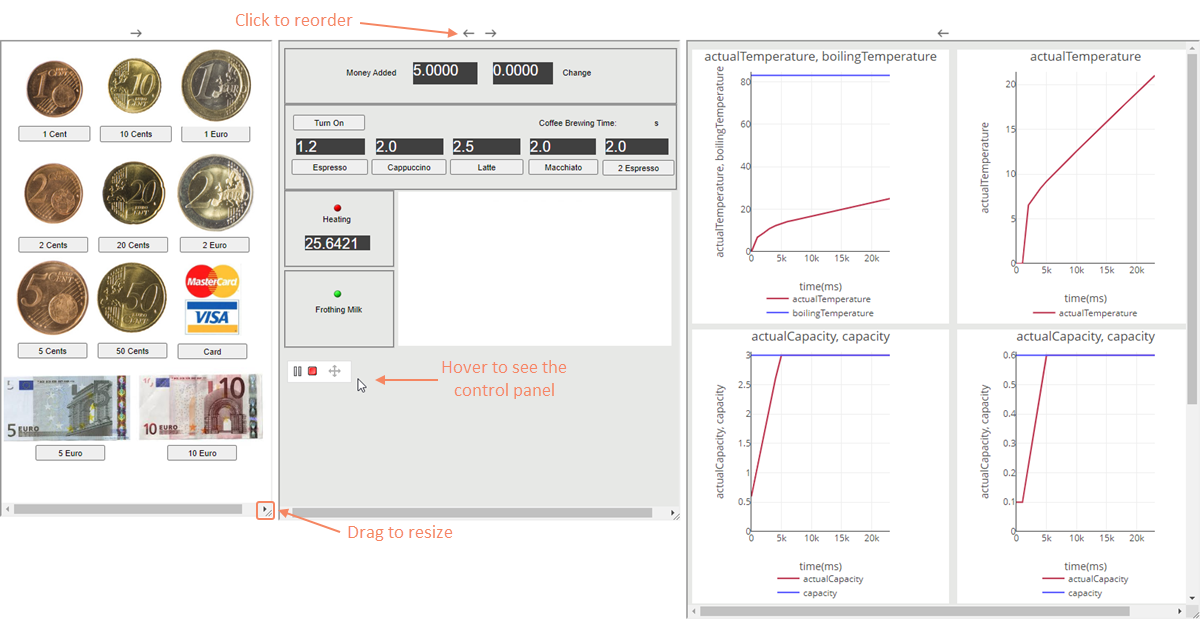
When simulating a model with aUI mockup, Time Series Chart, Timeline Chart, or HTML Table, you can open a UI or index UI window during model execution. These windows display all UI elements of the executed Simulation Configuration and have a control panel allowing you to start, pause, resume, or terminate the simulation. The benefit of using an index UI window is that it allows you to reorder and resize each individual UI since they are displayed in separate boxes, as shown below.
Image Modified
A UI index window where you can reorder and resize all existing UIs.
To run the server-side simulation with UI
In your modeling tool, open the User Interface Modeling Diagram where the relevant UI elements are displayed.
In the diagram toolbar, click Image Modified and select Generate and Attach HTML. For more information see Auto-generating HTML files.
Run the simulation on the server in one of the following ways:
Run the simulation using REST API or Jupiter Notebook, then open the index UI window by doing the following:
Check the simulation status.
Go to the URL given as the 'indexUI' in the response of the status request to open the index UI window containing all UI elements of the executed Simulation Configuration.
Tip
To open each UI element of the executed Simulation Configuration separately, go to the URLs given under 'ui' in the response of the status request.
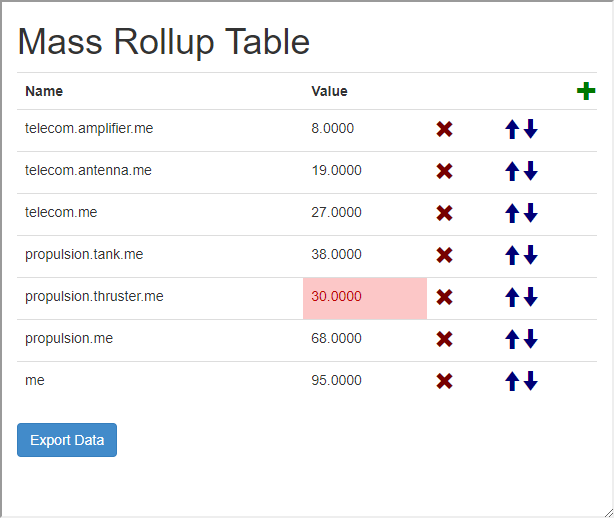
Time Series and Timeline Chart data is exported to HTML/CSV and stored in the Documentation property of the result Instance Specification when all of these conditions are met:
Simulation Configuration has an assigned Time Series or Timeline Chart, in which the recordPlotDataAs tag is set to HTML/CSV, and the resultFile tag is empty.
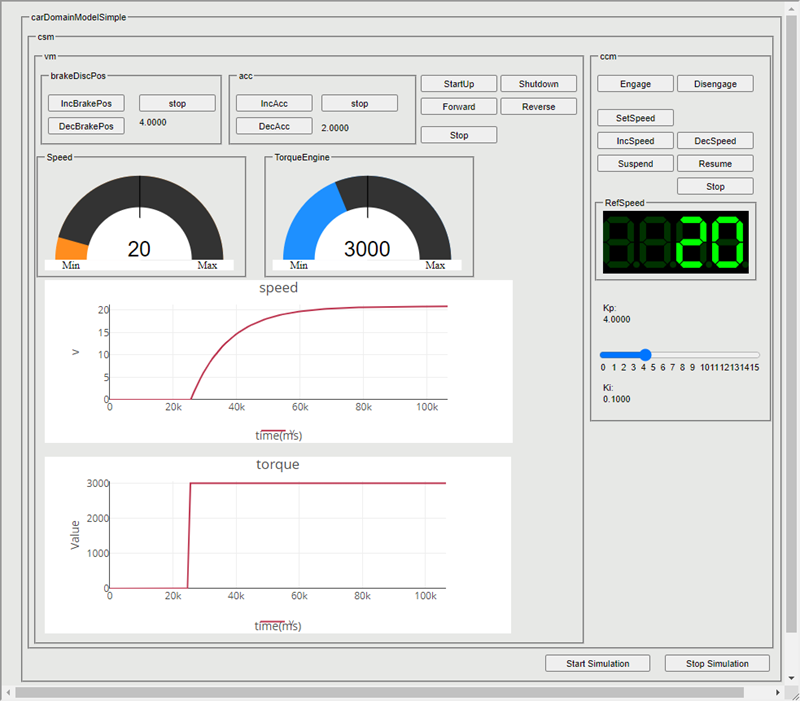
During server-side simulation, you can open the following UI types:
UI Mockups including Frame, embedded Widgets, and Image Switcher.
Image Modified
Timeline Charts displaying Activity and State plots. Numeric, boolean, and enumeration value plots cannot be displayed. In addition, Requirements and Constraint failures are not annotated.
Note
Timeline Charts do not need to be generated and attached to a Teamwork Cloud project.
Image Modified
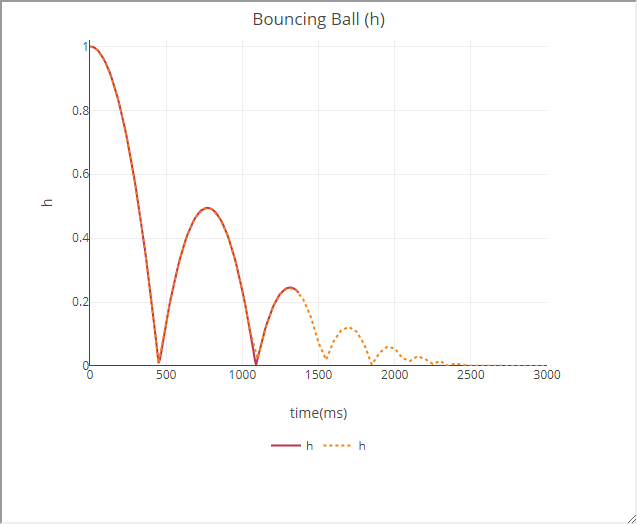
Time Series Charts which are updated in real-time during simulation. Note that Requirements and Constraint failures are not annotated in Time Series Charts.
Note
Timeseries Charts do not need to be generated and attached to a Teamwork Cloud project.